Best Day Trading Patterns
Are you looking to learn the best day trading patterns for beginner or advanced traders that work best to make the most of your day trading?
If so, you are in the right place.
Knowing which patterns and strategies work best can give you an edge,
When it comes to trading in Forex, stocks, options, cryptocurrencies, and other financial markets.
Different Trading Patterns for Day Traders
In this article, we’ll discuss the 8 best day trading patterns and day trading strategies for beginner and advanced traders.
The patterns we will mostly discuss in this article include:
- Candle Patterns,
- Reversal Patterns,
- Continuation Patterns,
- Breakout Patterns,
Learning these key patterns will allow you to get better trade entries and exits in your trading.
Throughout this article,
I will explain all these topics with the Best candlesticks and chart patterns with many graphical and real chart examples so that you can better understand and apply the concepts in real trading.
These strategies have been tested and refined over time to deliver consistent results in any market condition.
So, keep reading on to learn more about how these different candle and chart patterns will help you to become a better day trader!
Best Candle Patterns for Day Trading
Candle patterns are graphical representations of price action that provide insight into market sentiment and potential future price movements.
They can be used to identify trends, support and resistance levels, and short-term reversals.
Although there are many candlestick patterns that can be used in day trading,
I will only mention two candlestick patterns that you will find in your chart very frequently and which work really well to enter a trade.
Two of the Best Candlestick Patterns for Day Trading are the:
- Engulfing Candles
- Inside Bar Candle
I will now talk about these candlestick patterns briefly that can be used in various types of trading like day trading, intraday trading, or swing trading.
Let’s get started.
Engulfing Candle in Day Trading:
Engulfing candles are one of the most popular Japanese candlestick patterns that fall in the reversal candlestick patterns category – when it comes to entering profitable trades.
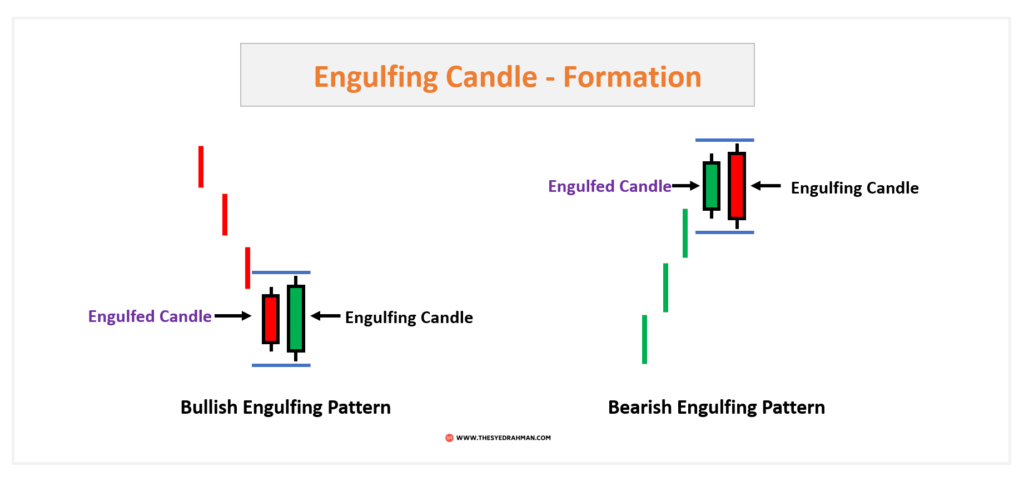
Identity: Bullish engulfing candles have a large green body (bullish candle) that completely engulfs or covers the prior red candle (bearish candle),
Indicating a possible reversal in momentum from bearish to bullish.
And, a bearish engulfing candle has a large red body (or any bearish color) that completely engulfs the prior green candle (bullish candle),
That signals a possible reversal in momentum from bullish to bearish.
A good place to look for the bullish engulfing candles is at the bottom/swing low/support level to trigger buy trades.
And, a best-sell trade entry with bearish engulfing candles is at the top/swing high/resistance levels.
Engulfing Candle Example:
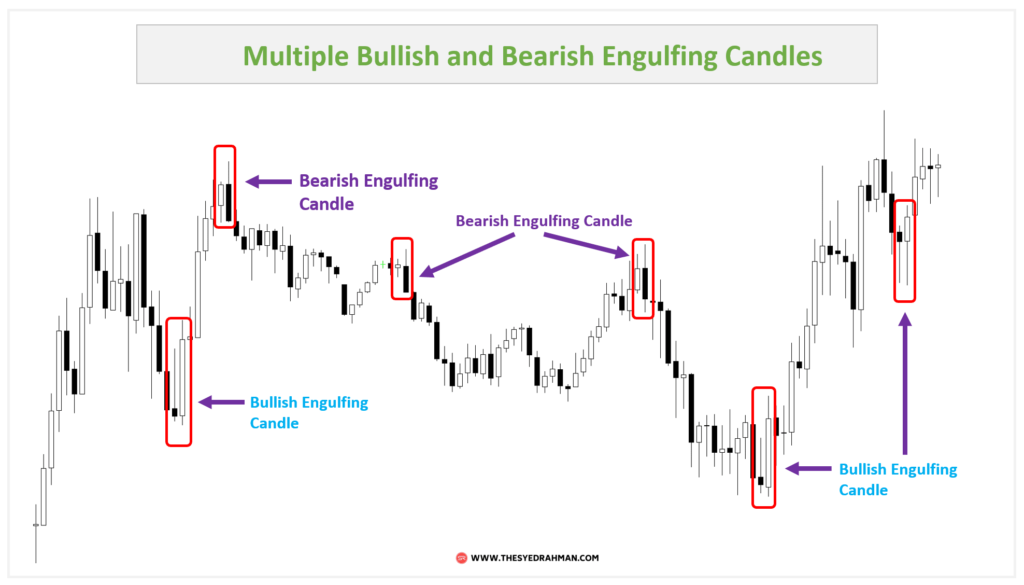
In the chart above, you can see multiple bullish and bearish engulfing candlestick patterns formed at the swing lows and swing high points in this one 30-minute chart.
All these engulfing candles indicated strong buy and sell trade entry signals,
And the price continued going in those directions after the formation of the engulfing patterns.
If you can identify this pattern correctly at the right place in the market then it can bring you a lot of profit in your day trading or swing trading.
Inside Bar Candle in Day Trading:
Inside bar candles are very powerful and one of the most traded and looked-for candlestick patterns in day trading.
Identity: So, what is a valid inside bar candle look like?
Well, they are completely opposite of the look of the engulfing candles.
An Inside Bar Candlestick Pattern is a two-bar reversal candle pattern that consists of a smaller candle inside the range of the prior larger candle.
In candlestick trading, an inside bar candle is commonly used to indicate a potential change in trend or market consolidation.
Note: There can be multiple inside bars (small candles) inside the mother candle (large candle).
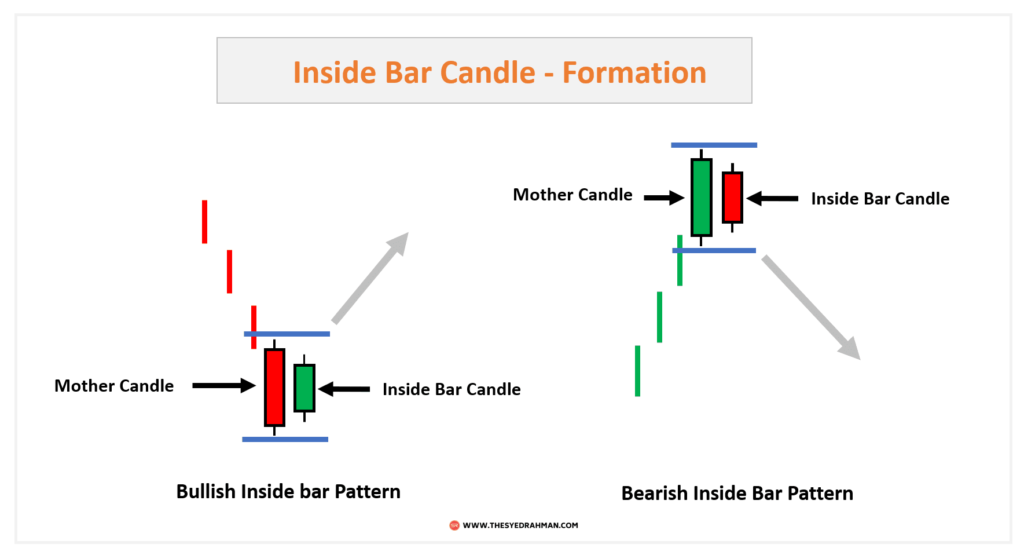
A valid(tradeable) bullish inside bar candle pattern forms when a single (or multiple) small green (bullish) candlestick is completely within the range of the previous red (bearish) candlestick – at the bottom or swing low point or at a support level.
So, this indicates that buyers overpowered sellers during the period and signals a potential reversal to upward momentum.
On the other hand,
A bearish inside bar candle occurs when a single (or multiple) small red candlesticks is completely engulfed by the previous green candlestick
And this indicates that the sellers overpowered buyers during this period,
Potentially signaling an upcoming downtrend.
Inside Bar Pattern Example:
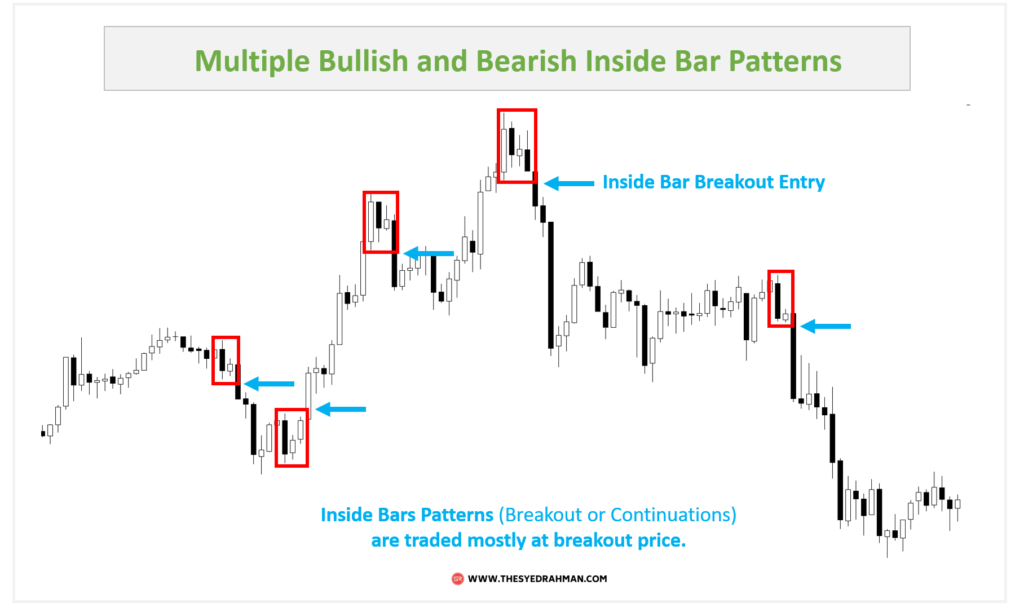
In technical analysis, inside bar candles are mostly traded when the price breaks the high or low of the mother candle (the big candle that) in the chart.
Also, inside bars candles can be traded as breakout candles or continuation candles depending on their position and breakout direction.
In general, make a buy trade with inside bars when the price will break the high (for buy trades) or low (for sell trades) of the mother candle.
You can watch my video here on YouTube where I talked in more detail about how you can do chart analysis using these inside bar candles to get profitable trade entries in the market.
Chart Patterns for Day Trading
Now, let’s talk about some of the best price action-based chart patterns that will be occurring most of the time in most of the charts,
And which are very easy to identify to trigger a profitable trade entry.
Trading chart patterns are basically used in breakout-based trading strategies, by assuming that the market will reverse from its current state.
So, whether they are reversal patterns or continuation patterns,
Our initial thought should be to enter trades after the breakout of the pattern.
With that in mind,
Let’s start to know some of the very powerful price patterns for trading.
Consolidation Pattern for Day Trading
Consolidation patterns are one of the most occurring and profitable day trading patterns in Forex, Stocks, and other financial markets.
A consolidation pattern forms when the price is restricted to a narrow trading range whether in an uptrend or a downtrend,
And the candles are usually very choppy, small to medium-sized, and signal no specific market direction.
This pattern usually occurs after a strong bullish or bearish rally.
This type of pattern typically indicates that the buyers and sellers are unable to agree on a direction for the price,
Which leads to sideways movement until one side (either buyers or sellers) gains enough strength to push the price in that direction.
When this happens, the consolidation pattern should break in the direction of the new trend or ongoing market momentum.
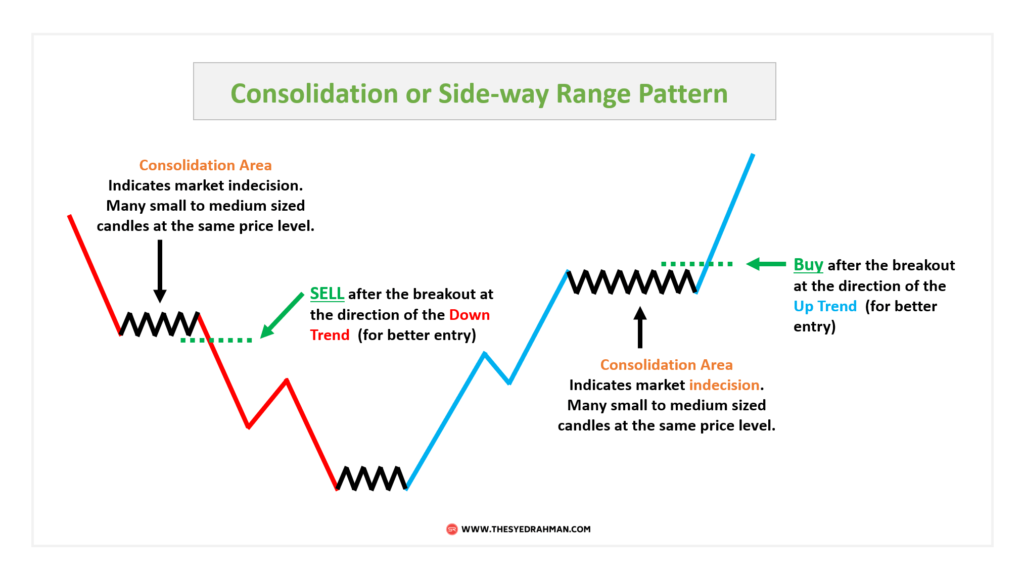
When trading these patterns, you should look out for a breakout either above the resistance level (upside breakout),
Or below the support level(downside breakout).
Once the price breaks out of this range, you can decide whether to buy or sell.
Now, let’s have an example of chart consolidation:
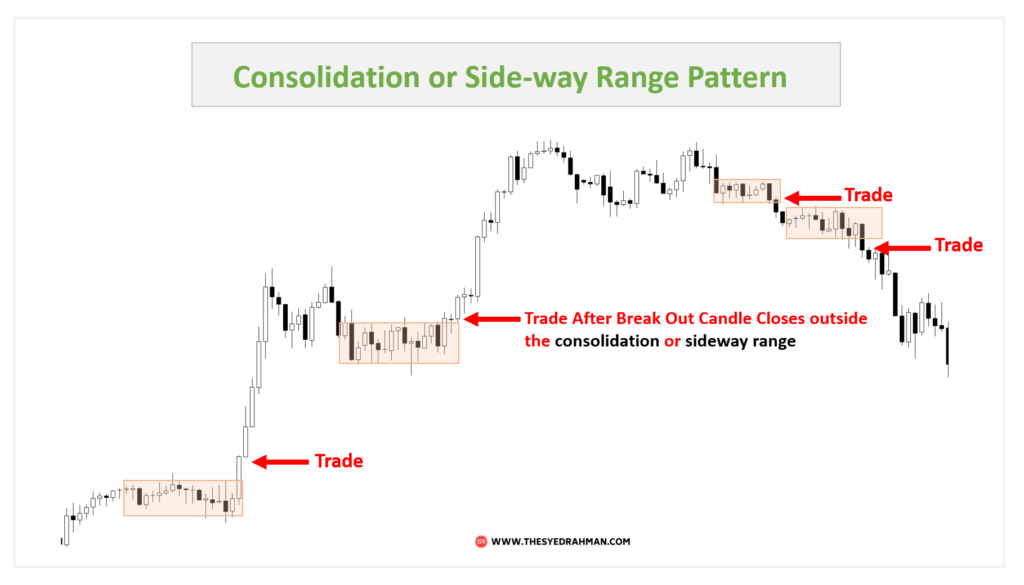
As you can see there are multiple numbers of market consolidations or sideway ranges formed in this one single stock chart.
So, how do we trade a consolidation pattern like this?
The best way to make buy trade entries in the consolidation area is when the consolidation forms at the top or bottom in an uptrend or bullish rally,
And the breakout candle is also a bullish candle indicating the continuation of the uptrend.
In the same way,
Find sell trade opportunities in the consolidation area when the consolidation forms in a downtrend or after a bearish rally,
And the breakout candle is also a bearish candle indicating the continuation of the downtrend momentum.
Note: It is also important that you pay attention to any important economic news releases that might cause a sudden surge in price moves and trigger a fake breakout.
Double Top Pattern for Day Trading
A double-top pattern is a bearish reversal chart pattern that is a twin-peak chart pattern that mostly indicates a bearish reversal from an uptrend.
The double-top pattern is made up of two peaks above a support level, also known as the bottom or neckline.
The first peak (Top 1) will come after an extended move-up in an uptrend, and the second peak or resistance (Top 2) will be unable to break the high of the first peak (Top 1).
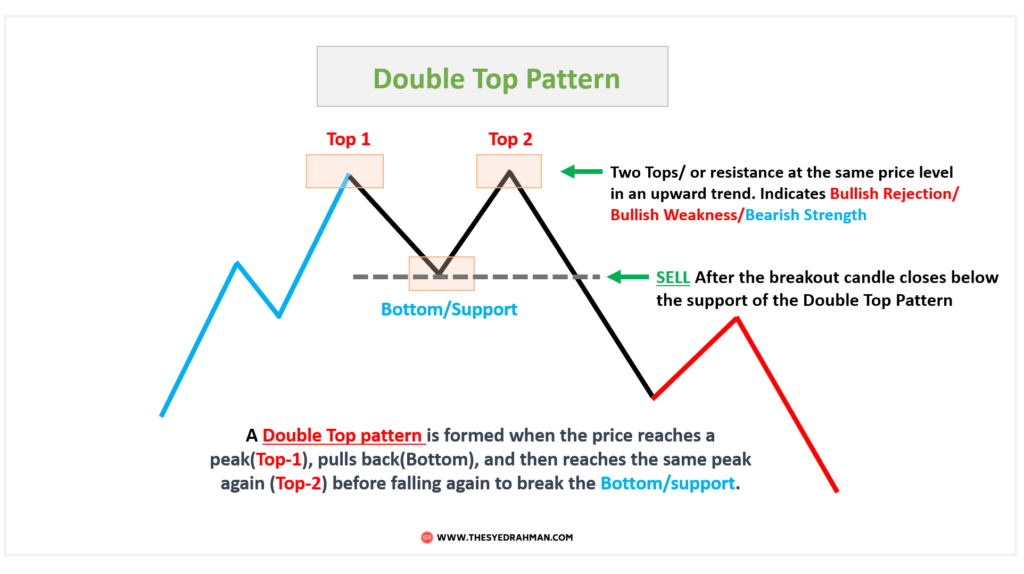
Once the price breaks down the neckline or support of the double top pattern, it is a sign that a trend reversal has begun.
The double top pattern looks like an “M” from the english alphabet.
Example of Double Top Pattern:
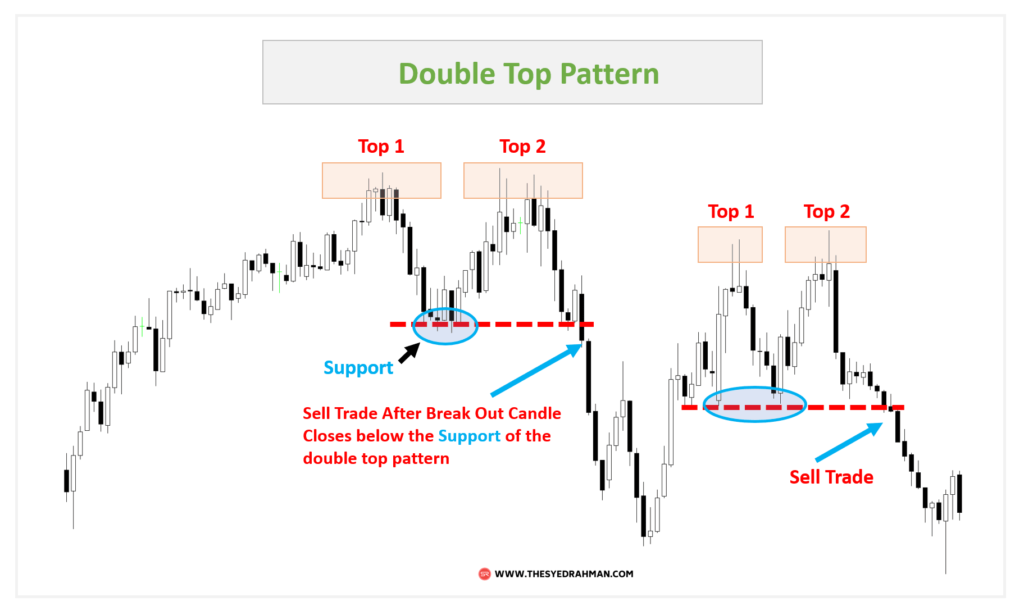
In the candlestick chart above, you can see two back-to-back double-top patterns in the real market.
When trading a double-top pattern, the following rules should be considered:
- There must be an existing uptrend before the pattern appears;
- There is an appropriate amount of gap between the tops and their neckline (*more on this later)
- You can place your sell trade entry when the price breaks the support/bottom of the pattern and the breakout candle is below the support or neckline.
- Place your stop loss above the second high (although this can be a big number, if so then reduce your trade lot size).
- Set your profit target at the same height as the height of the 2nd top(length is from the support to the 2nd top).
*Also, you need to look for a decent amount of price gap between the tops of the double pattern.
This means that when the price reaches the top of the pattern, the highs of the two peaks should be relatively close to each other, indicating a lack of buying pressure.
Remember, if the peaks are too far apart from each other, it could indicate that the pattern is not a double top and that a continuation of the trend could take place.
Double Bottom Pattern for Day Trading
The Double Bottom Pattern is a popular chart pattern used in day trading which is an exact opposite replica of the double top pattern.
It is a reversal pattern that signals a potential change in the downtrend, and the pattern looks like a “W” from the English alphabet.
The Double Bottom Pattern occurs when the prices make two consecutive lows or support levels at almost the same price level and then rally in between the two bottoms for some time.
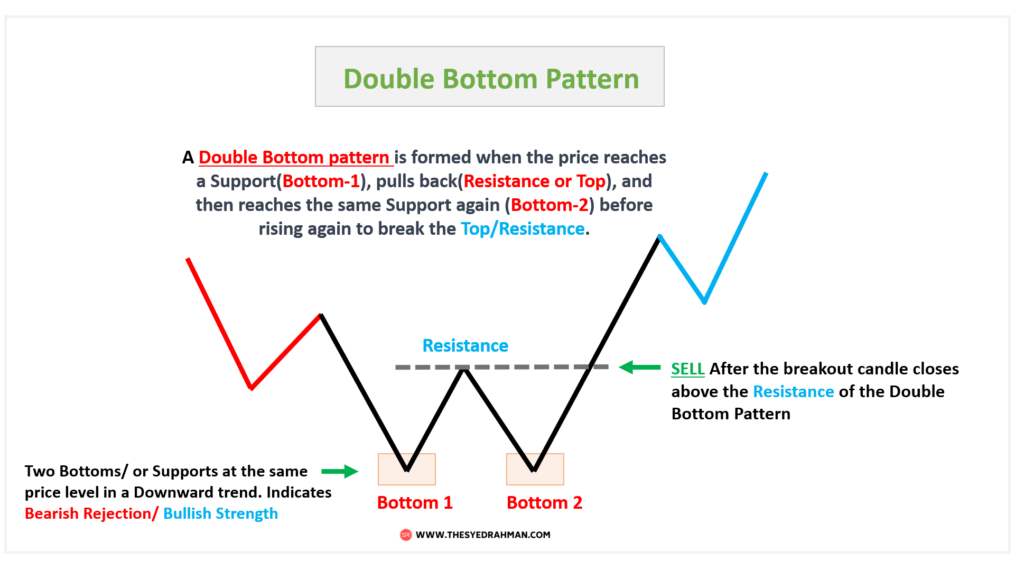
Basically, the first bottom here acts as a support level for the 2nd bottom where the price loses its strength to break the first support,
And bounces back in an upward direction to test and break the resistance level to begin a new uptrend.
The breakout of the resistance line from the top provides a good entry point to make buy trade orders.
Double Bottom Pattern Real Chart Example:
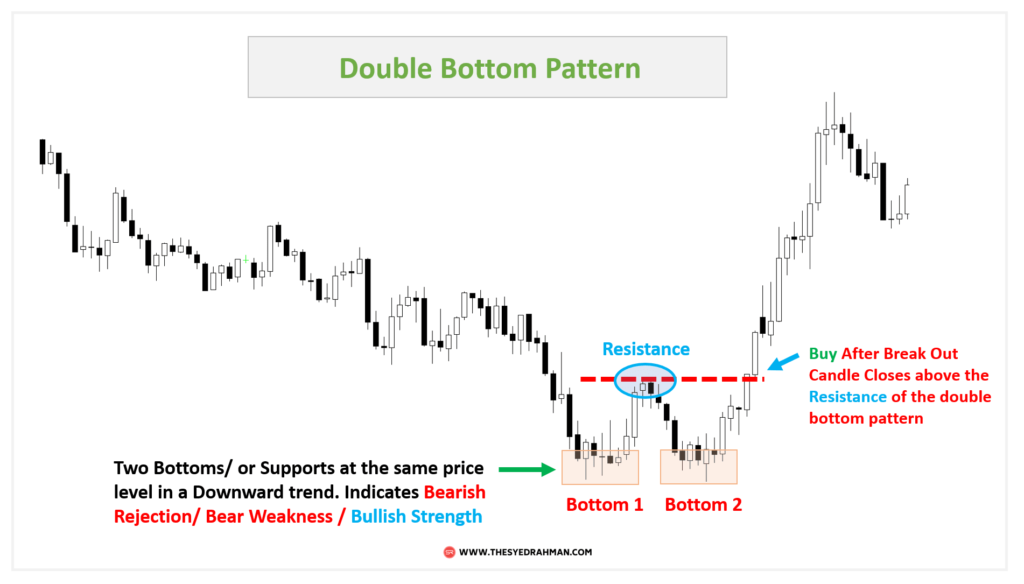
In the chart above, you can see a double-bottom pattern formed at the end of a downtrend.
Here, both the bottoms/support signaled a bullish reversal as it shows sellers were unable to push the price further down to break the first support/bottom and continue the downtrend.
Then next, the breakout of the resistance line gave the final confirmation of the end of the downtrend and the beginning of a new uptrend.
You can buy at a double-bottom pattern after the bullish breakout candle closes above the high of the resistance line.
A stop loss can be set at below the 2nd support, and the take profit can be the size equal to the resistance line to the 2nd support level.
Rising Wedge Pattern for Day Trading
The Rising Wedge pattern is one of the triangle chart patterns in technical analysis which is a very popular and powerful chart pattern used by day traders and swing traders.
It is characterized by two converging trend lines that are sloping upwards in an almost conical shape.
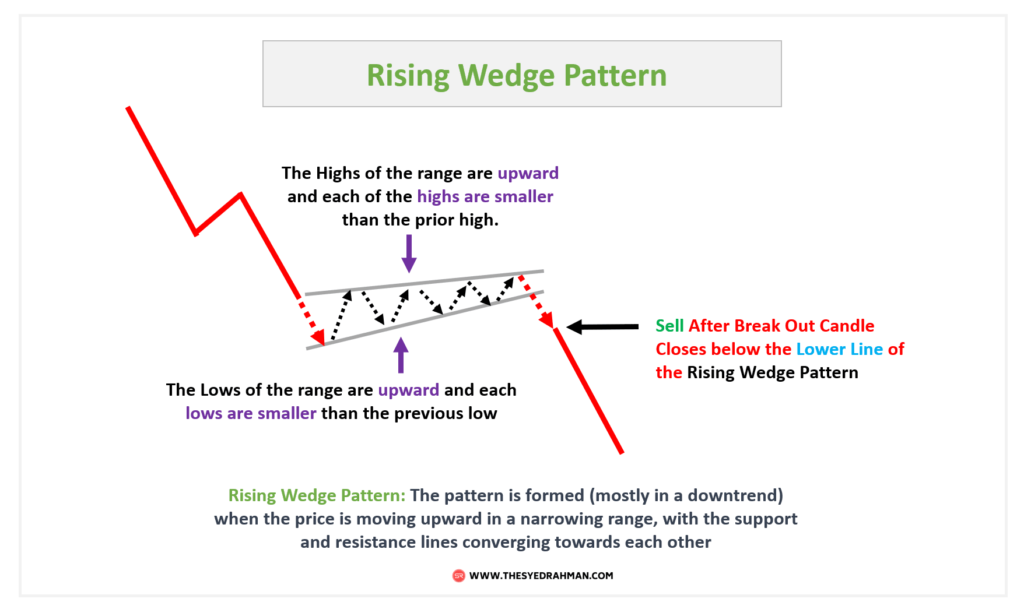
The price action of this pattern looks like both the upper trend line and the lower trend line is ascending or rising up,
Although the volume and the volatility is decreasing gradually which gives this a semi-triangular shape.
This could be seen as an indication that the bullish momentum is fading and that there may be a potential reversal in the near future.
Now, let’s have a real chart example of this pattern:
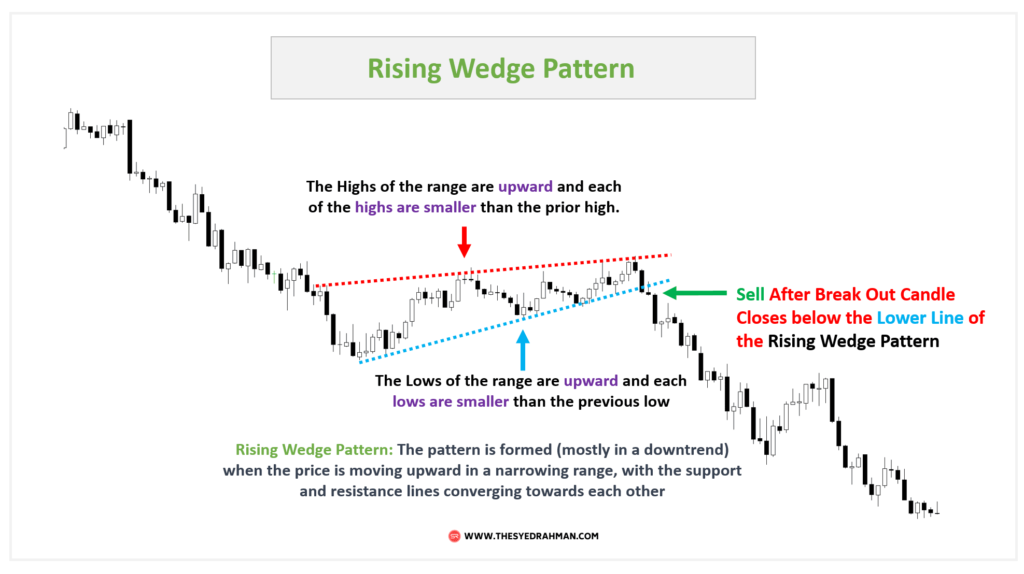
So, you can see a rising wedge pattern in the chart above.
You should notice how the price rally (or the candles) is getting narrower as volatility is also decreasing in each candle,
Which only signals a future breakout in either direction.
Therefore, you can usually enter into a long position with this pattern when you observe a breakout above the upper trend line or go short if there is a breakdown below the lower trend line.
But mostly you will see this pattern form in a downtrend market,
And generally, the rising wedge pattern works as a trend continuation pattern.
So, most of the time you should look for a breakout in the downward direction and thus go for sell trade entries after the breakout candle closes below the lower line (or upper line if a bullish breakout occurs).
This is a very ideal chart pattern for not only day trading but also for swing trading as well.
Falling Wedge Pattern for Day Trading
The Falling wedge pattern is the opposite type of a rising wedge pattern and is also a popular day trading pattern.
This pattern is identified by two downward-sloping trend lines that converge together.
You can see that each of the swing highs is lower than its previous swing high, and each of the swing lows is lower than its previous swing lows in size.
This indicates that buyers are starting to step in and counter the downward momentum.
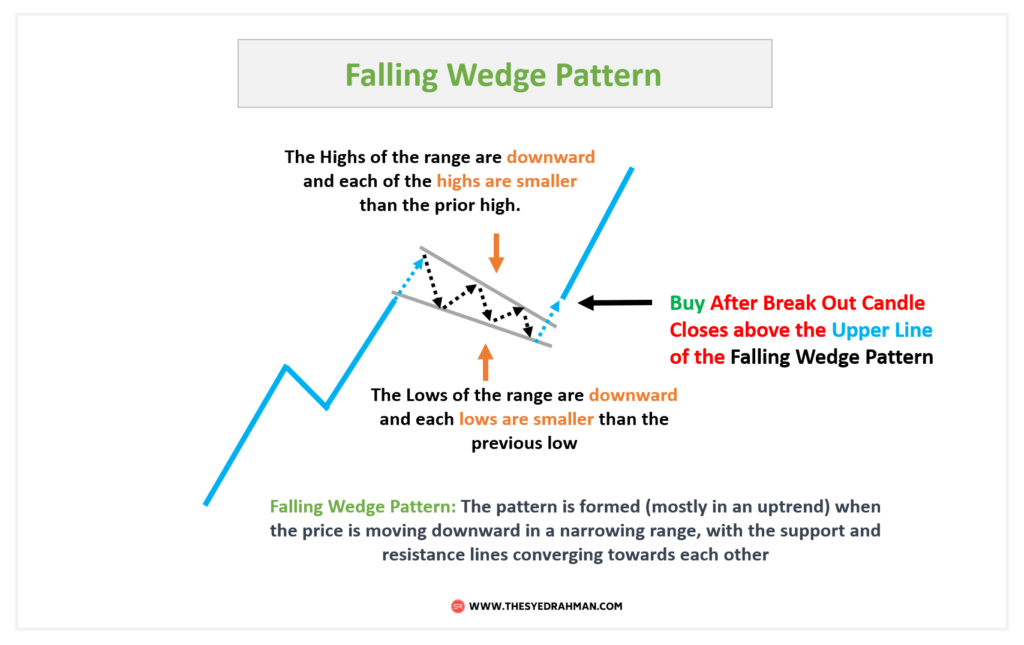
When trading a Falling Wedge Pattern, it is important to wait for a break above the resistance line/ upper trend line before entering a buy trade position.
Similarly, wait for the price to break the lower trend line to enter for short trade entry.
It is recommended to place protective stop-loss orders below the support line in case of a false breakout.
Additionally, you can set your profit target near the next resistance level or Fibonacci expansion level when trading this pattern in day trading.
Let’s have a look at a real chart example of a falling wedge pattern:
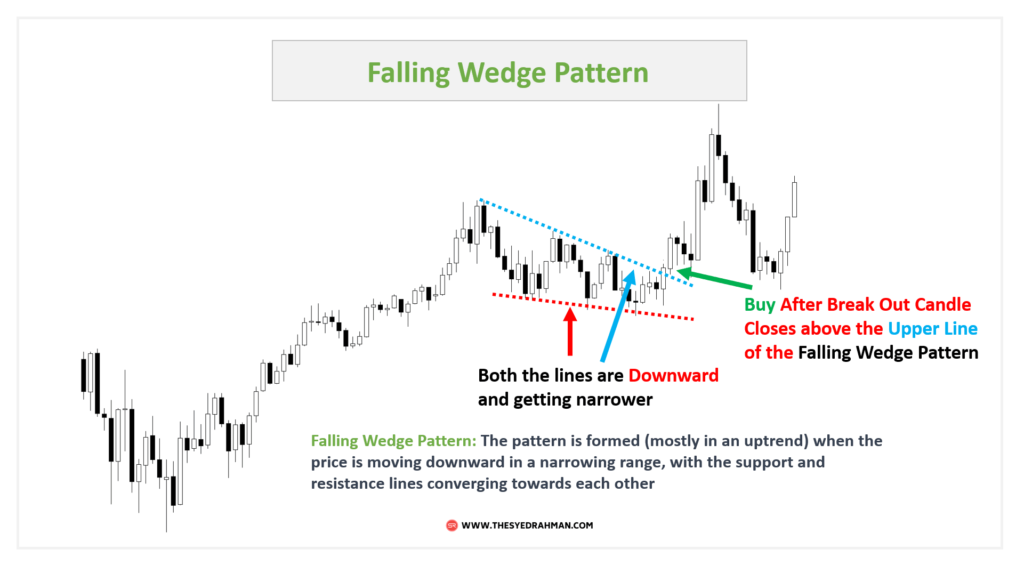
As you can see in the above chart, the price was making a downward slope with an upper and lower trend line that indicates decreasing selling pressure, and a potential to breakout in the upward direction.
And finally the price breakout the range as you can see a bullish candle formed and closes above the upper trend line.
A falling wedge pattern is most likely to form in an uptrend market and in general, this work as a trend continuation pattern.
So, a bullish breakout in a falling wedge pattern is an ideal buy trade setup where the chances of a fake breakout are much less compared to a bearish breakout of this pattern in an uptrend.
Rectangle Pattern for Day Trading
A Rectangle Pattern is formed when the price of a security consolidates between two horizontal upper lines and lower lines for a really long period of time(relative to the chart timeframe).
The upper line represents resistance, and the lower line represents support.
This rectangle pattern is also called a Range-bound pattern as price and tends to range between both the upper and lower line of this pattern.
A breakout from the rectangle pattern, either to the upside or downside, is often considered a sign of a potential trend reversal.
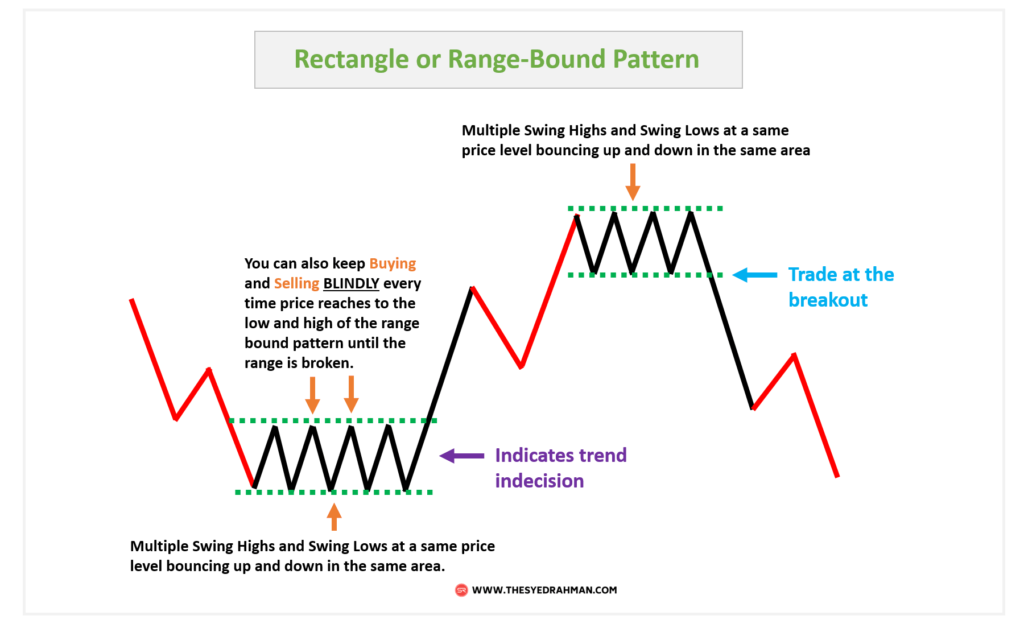
This is a similar type of pattern to the consolidation or sideway pattern we looked at earlier in this article.
The noticeable difference is, in a consolidation pattern, there are no distinguishable swing points/ or tops and bottom levels,
But in a rectangle pattern, you will see specific highs and lows forming at the upside and downside of the rectangle.
In day trading, traders look for a break out of this rectangle pattern to enter trades in the direction of the breakout.
Let’s have an example of this pattern with a real chart:
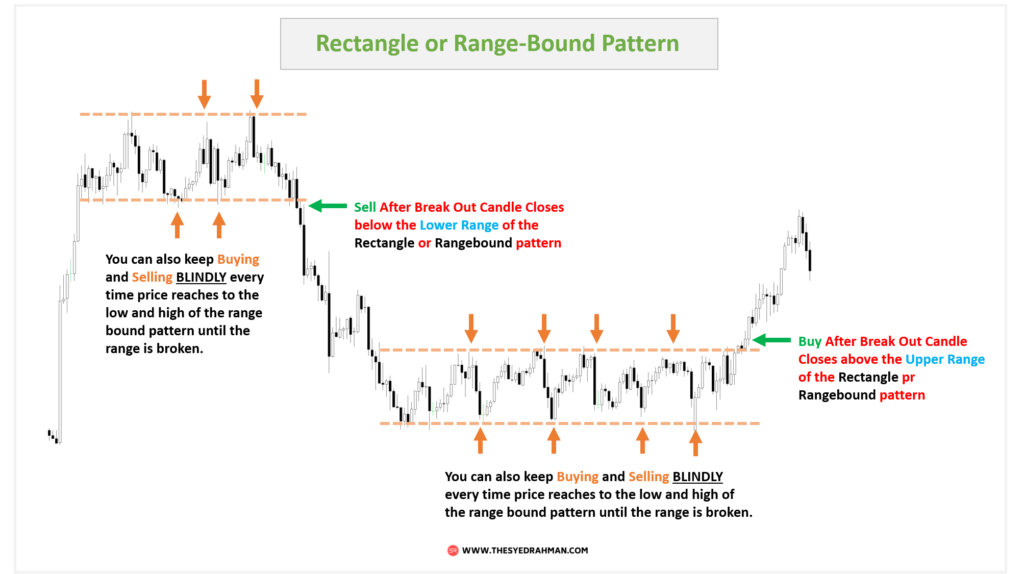
You should notice two back-to-back rectangle patterns in the chart above.
One rectangle pattern formed at the top of an uptrend and the other formed at the bottom of a downtrend market.
Both of these patterns in this chart acted here as a reversal pattern.
So, the first pattern at the left broke the uptrend as after this pattern breakout price continued to go down.
And the 2nd rectangle pattern acted here as the breaker of the previous downtrend as its appearance left the market to consolidate for a very long time
And finally, buyers came with the strength to push the market up by breaking the range.
Therefore, in a rectangle pattern like this, you can either trade in the direction of the breakout (buy if the bullish candle closes above the range, and sell if the bearish candle closes below the range),
Or you can keep buying and selling blindly each time price comes near the lower line or upper line of the range.
This is a very popular and best pattern as you will find this pattern in your chart very often, and mastering this pattern will help you win many more trades in day trading.
Conclusion:
So, these are all the best chart patterns that I believe will greatly help you improve your trading.
Whether you are a trader looking for stock chart patterns, or forex chart patterns to find good trade entries, you can rely on these patterns for sure.
There are also some other important day trading chart patterns I did not mention in this post which I will be talking about in the next article.
Some of these patterns are the Ascending Triangle pattern, descending triangle pattern, head and shoulder pattern, cup and handle pattern, pennant pattern, flag pattern, and some triangle patterns, etc.
And don’t forget to join my Download Library to download some really helpful trading resources for free.
Let me know in the comment if you want me to write the 2nd part of this article to talk about the other chart patterns I did not mention in this post (since I did not want to make you bored with all the patterns to learn in the same post and forget).
Also, let me know in the comment if you have anything to ask or say.
I will appreciate your response.
Thank you for reading.
Have a good day… or night.
Syed Rahman