
Multiple Timeframe Analysis is a technique that involves looking at the same security over different time frames – such as 1-minute, 5-minutes, 1-hour, 4-hour, and daily charts.
This approach is mostly used by technical traders to gain better insight into the market trends of a given security, like EURUSD, Apple, Bitcoin, etc.
By studying the same security in different time frames, you can gain a better understanding of the direction of the overall trend.
For instance, you may observe a strong uptrend on the daily chart but spot a potential reversal on the 4-hour chart.
This type of analysis can help you to make more informed decisions and increase your chances of trading success.
Additionally, you can use multiple timefram analysis to validate trading signals and identify entry and exit points for trades.
For example, you may observe a bullish candle pattern on the 1-minute chart, but then wait for a confirmation from the 5-minute chart before entering a trade.
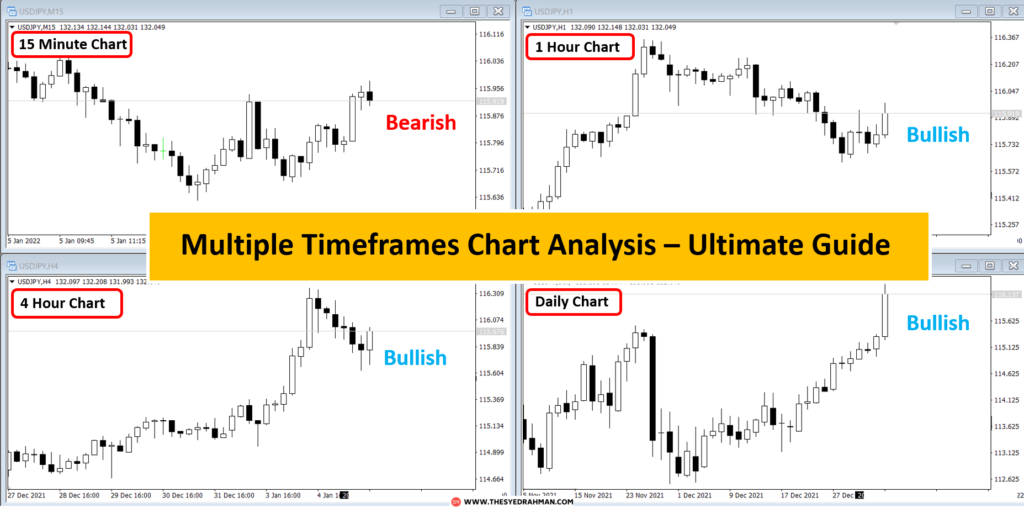
Let’s have an example with charts:
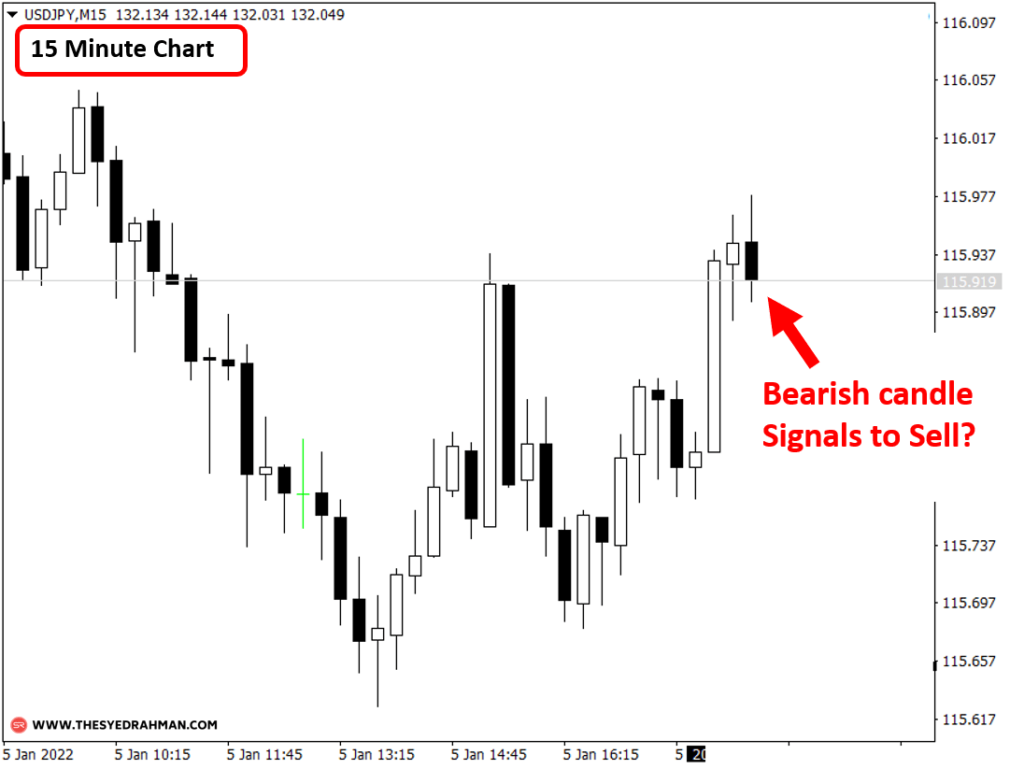
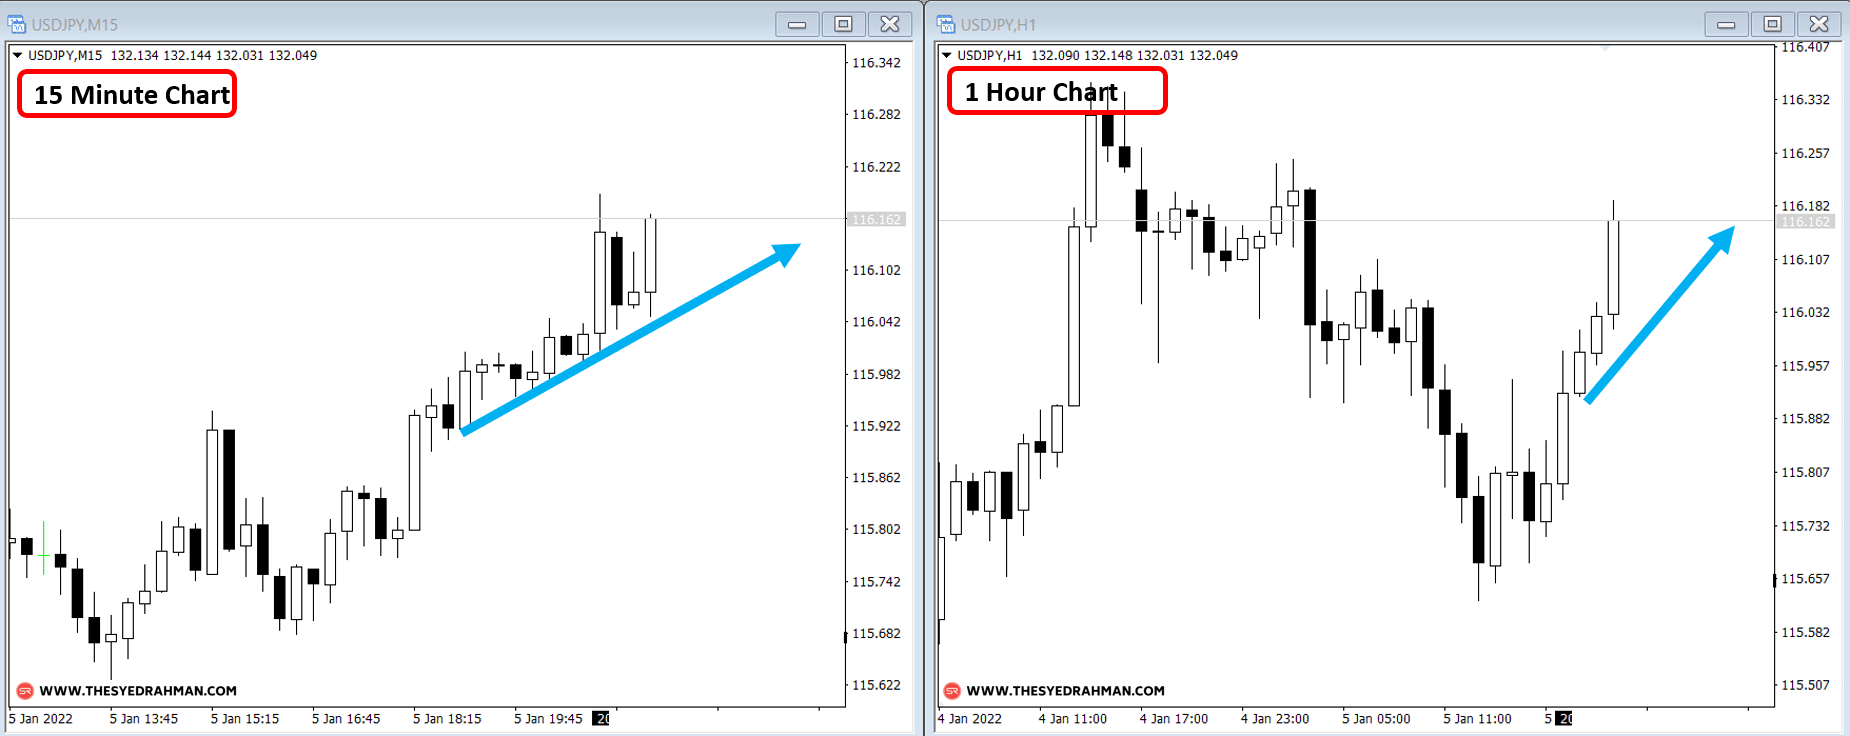
When you see a bearish candle in a 15-minute chart you feel like opening a sell order,
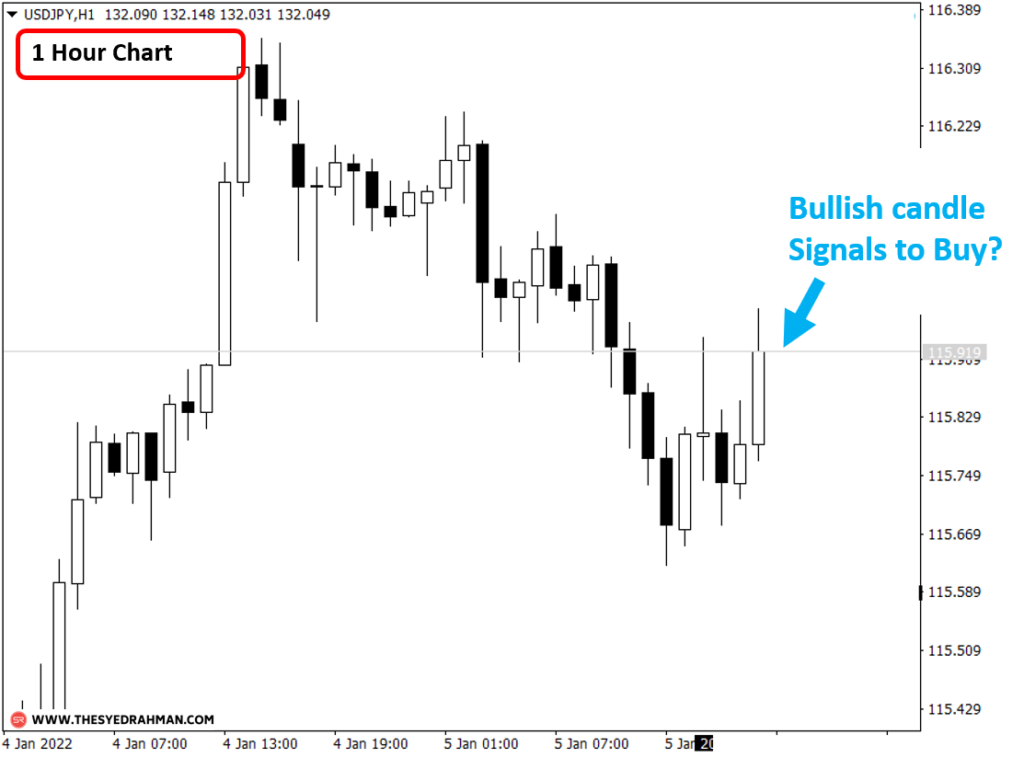
But when you go to the 1-hour chart it looks like the price is going up and the last candle is a bullish candle which signals to go for long.
So, here, what direction should you follow to make trade entries?
do you open buy positions following the 15-minute chart?
or open sell orders by following the direction of the 1-hour chart time frame?
Well, there we need to do multi timeframe chart analysis to overcome this confusing situation and make better decisions to take profitable trade entries and exits.
Which we will be covering in this article in greater detail with many chart examples.
So, let’s get started.
What is a multiple timeframe analysis?
In short, it is looking at charts of a trading instrument (EURUSD, Apple, Bitcoin,etc.) from a number of different chart timeframes to understand the price action and market sentiment in each of those different charts (15 minute chart, 1 hour chart, etc.).
When using multiple timeframes, traders look for signals that agree across all timeframes.
It is one of the most important criteria to make profitable market entries and exits by going with the overall general trend of the market
as this allows us to make buy-sell decisions by combining price action trends from different charts.
You can use multiple time frame analysis to trade successfully in Forex, Stocks, Cryptocurrencies, or as an investor in any other financial markets.
Is it Necessary to Use Multiple chart analysis
So, is multi timeframe analysis necessary?
The short answer is a big YES
It’s extremely important to do technical analysis using multiple time frames
In order to make your trades align with the most number of traders from different chart time frames in the market.
This way the chances of winning a position get higher
Understand it this way,
There are traders who look to find trade entries and exits in the 5-minute chart
Also, there are traders who are more dedicated to trading the 15-minute chart only, or who prefer only the 1-hour or the daily chart.
whether weak or strong, each of the charts has its own market trend,
And, if let’s say 2, 3 or even 4 charts at the same time indicates bullish price movement,
Then most of the traders in all of these different timeframes will make buy positions at the same time.
Which will increase the demand and create even stronger bullish momentum and an uptrend in the market.
And going with all of the traders in the same direction of the trend will increase your chances of winning the trades.
Remember the earlier chart example?
There we saw a bearish candle in the 15 minute chart and a bullish candle in the 1 hour chart.
And let’s say you opened a short sell order after the bearish candle by thinking that the market will go down
But if you switched to some other chart timeframes,
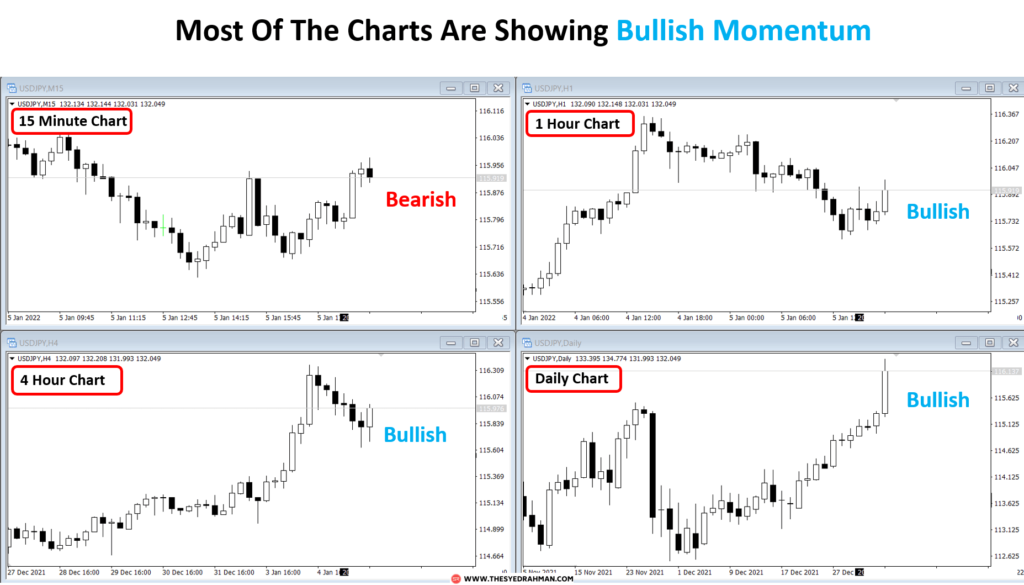
You could see that the 1-hour, 4-hour, and daily charts are all showing bullish market momentum,
So, sooner or later the chances are high that the market will go up only by making a loss for the sellers in the 15 minute chart
As more timeframes or overall market sentiment is bullish,
This is what happened in this case
That’s why it’s important to trade using multiple timeframe analysis in order to match the overall market psychology.
So, never rely on one time frame only to make your trade entry and exit decisions.
If you do so, then you will lose more trades than you win.
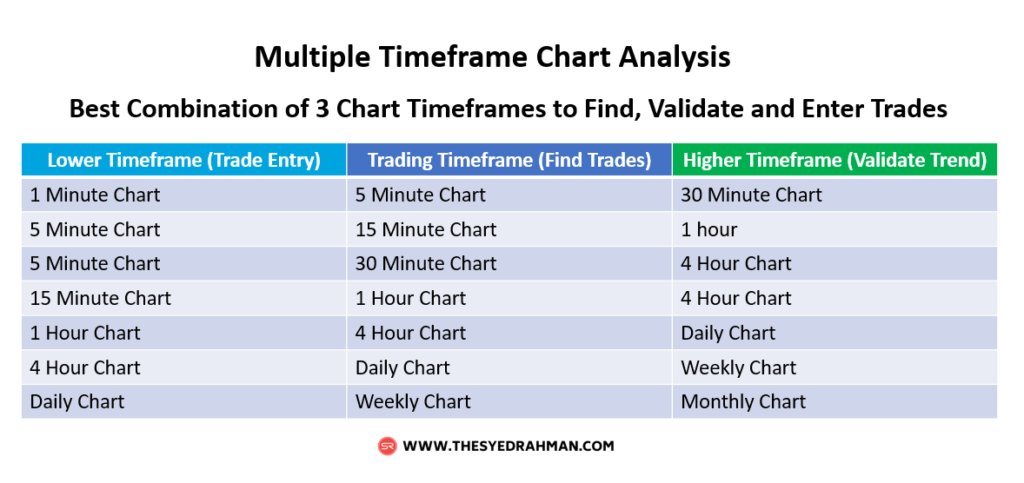
How many time frames should you use for multiple timeframe analysis?
In short, you should use and analyze charts in at least 2 and a maximum of 3 different time frames for any trade entry position.
Looking at more than 3 charts will only confuse you to make the right trading decision.
Also, remember a very important thing that,
“The lower timeframes tend to follow the direction of the higher timeframes.”
So, prioritize the higher timeframes when you are unsure of the market trend you should be following
If you want to analyze a minimum of two charts, then use your trading timeframe and a higher timeframe.
An ideal combination for multi time frame analysis should be based on 3 types of chart timeframes. These are:
-
- Trading time frame (Intermediate)
-
- One-step Higher timeframe (Longer term)
-
- One-step Lower time frame (Primary)
Let me first tell you what are these chart time frames
And later I will talk about how you can use the combination of these charts to get better trading positions.
What is the “Trading Timeframe” in Multiple Timeframe Analysis?
This is your preferred time frame where you are more comfortable, and find trade setups.
So, if you are a day trader and you mostly like to use 1 hour chart to find and identify general market trends and trade entries then this is your Trading Timeframe.
It can also be a timeframe where you found a potentially winning trade setup
Therefore, if you find that a strong bullish engulfing candle formed at the higher low of an uptrend in the 30 minute chart, and you want to execute a buy order for this setup, then this 30 minute chart is now your trading timeframe.
What is the “Higher Timeframe” in Multiple Timeframe Analysis?
This is the chart time frame where you will look for the longer-term trend of the market to validate trade setup on the trading timeframe.
The Higher time frame should be 4-6 times upper than your trading timeframe.
For instance, if you find trades at the 4-hour charts, then you should look at the Daily chart (4 hours * 6 = 24 hours ) to identify the longer period direction of the market.
The trend and the market momentum (bullish or bearish) in this timeframe must agree with the trading timeframe.
Therefore, if you find a buy position setup in the 30-minute chart, then come to look at the 4-hour chart to see if the market momentum is bullish in the 4-hour chart and support the trade setup you found in the 30-minute chart.
If the higher timeframe does not agree with the trading timeframe then this might be an invalid setup.
For example, if your trading timeframe indicates a buy trade signal, but the higher timeframe suggests the market is bearish, then there is a conflict and so you should avoid this setup to enter a position.
What is the “Lower Timeframe” in Multiple Timeframe Analysis?
This is the timeframe where you will look to confirm your trade position.
Mostly, in this timeframe, you will come to see if you should wait or not to catch a better price point to enter the trade setup you found in the trading timeframe.
The lower time frame should be 4-6 times smaller than the trading timeframe.
For example, if your preferred main trading timeframe is 1 hour chart, then your one-step Lower Time Frame is the 15 minute chart (60/4 = 15).
And if your preferred trading Timeframe is the Daily chart, then your one-step Lower Timeframe is the 4 hour chart (24 hours/6 = 4 hours).
3 Chart Timeframe Combinations
Below is the list of best chart combinations for multiple Timeframe Analyses:
Prioritize Higher Timeframes Over Lower Timeframes:
Remember, you should always give more priority to any higher timeframes than the charts on their lower timeframes.
Because lower timeframes tend to follow the direction of the higher timeframes.
So, if you see bearish market momentum (whether bearish candle or down trend) in a 4-hour chart,
But the daily chart (higher than the 4 hour chart) indicates bullish momentum (bullish candle or uptrend),
Then you should also consider going bullish and trading in the direction of the daily chart.
If both the trading timeframe and its higher timeframe signal opposite market directions or conflicts with each other,
Then you should stop trading and wait until market momentum in both the chart timeframes match with each other (both charts are bullish or bearish).
Multi Timeframe Strategy for “Swing Trading”
Swing Trading is by far one of the most popular and profitable trading strategies in Forex, stocks and other financial markets.
A while ago I wrote an article on Swing Trading Strategy, you can read it here to learn the steps to trade the swing of a trend.
Also, you can learn about my complete Swing Trading Strategy course here
Now, to do a multiple timeframe analysis for Swing trades, follow the structure below for a higher chance of winning the trades
Step 1: Find an Opportunity in the “Trading Timeframe”
First of all, find the general direction of the market in the trading timeframe.
You can use a 21 or 30 exponential moving average to find the trend.
Then look if the price is at or near the support or higher low level for the long position,
And near the resistance or Lower High level to look for short sell position.
In swing trading, it’s important you identify key market structures like support and resistance levels, or higher low and lower high levels in this trading timeframe to decide your potential trade position zone.
Find a strong candlestick pattern or price action pattern at the trade position zone to confirm the initial trade entry setup.
After you know where you want to buy or sell, now is the time you validate the trade position by looking at the longer period chart.
Example: Below is a 4-hour chart where we can see a potential bullish trade setup
As two back-to-back strong bullish candles formed near 30 moving average line (blue line) at a higher low level in the upward direction.
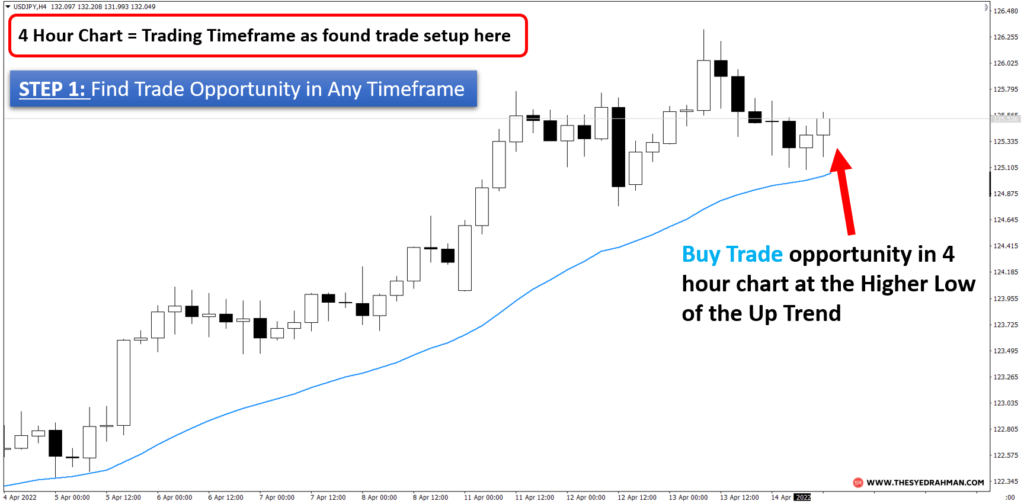
Since we found this trade setup in 4 hour chart, so this is now our trading timeframe.
Next, we need to confirm the trade position by looking at the overall trend/momentum of the market in its higher timeframe.
Step 2: Validate Swing Trade Position with the “Higher Timeframe”
After you find a potential trade setup in the trading timeframe,
You need to go to your Higher Timeframe to see if the trend and overall price action also support the trade position, and are not in conflict with your trading timeframe.
For instance, if your trading timeframe shows the price is at a higher low or support level, signaling to buy,
Then make sure your higher timeframe also trending up or is in bullish momentum,
And the price is not at the resistance level in the higher timeframe.
Example: For the trade position in the first step, we will now look at the daily chart as it is one step higher timeframe for the 4-hour chart.
The chart below shows that the market momentum is bullish in the daily timeframe as well.
This means the daily chart matches the trend and market momentum with the 4-hour chart.
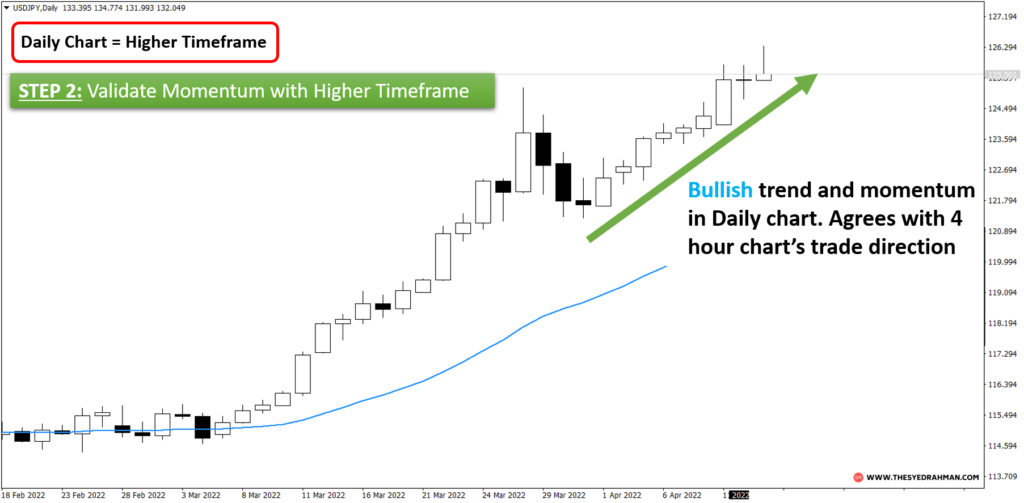
So, the trade position is confirmed.
Remember one thing, the lower time frames tend to follow the direction of the higher time frame.
Therefore, make sure your trading timeframe is aligned with the direction of your higher timeframe to validate the trade setup.
So, for the example charts above, since both the trading and higher timeframes are aligned and moving in the same direction and show similar bullish market momentum,
We will then proceed to the next step to find a sweet spot to enter our buy order.
Please notice: It is not compulsory to go to the lower timeframe to find a trade entry point. Only matching with trading and a higher timeframe is sufficient to enter a trade. But including another chart (lower) to confirm an entry is always beneficial.
Step 3: Confirm and Trigger Swing Trade position in the “Lower Timeframe”
Now that both the trading timeframe and higher timeframe support the direction of the overall market momentum and valid trade position.
It’s time you go to the lower chart timeframe to find a sweet spot or better trade entry pricing point to maximize your trade winner.
For instance, to trigger a buy position, you might wait for a strong bullish candle in the upward direction in your lower timeframe to confirm buying pressure in the direction of the trends in its higher timeframes.
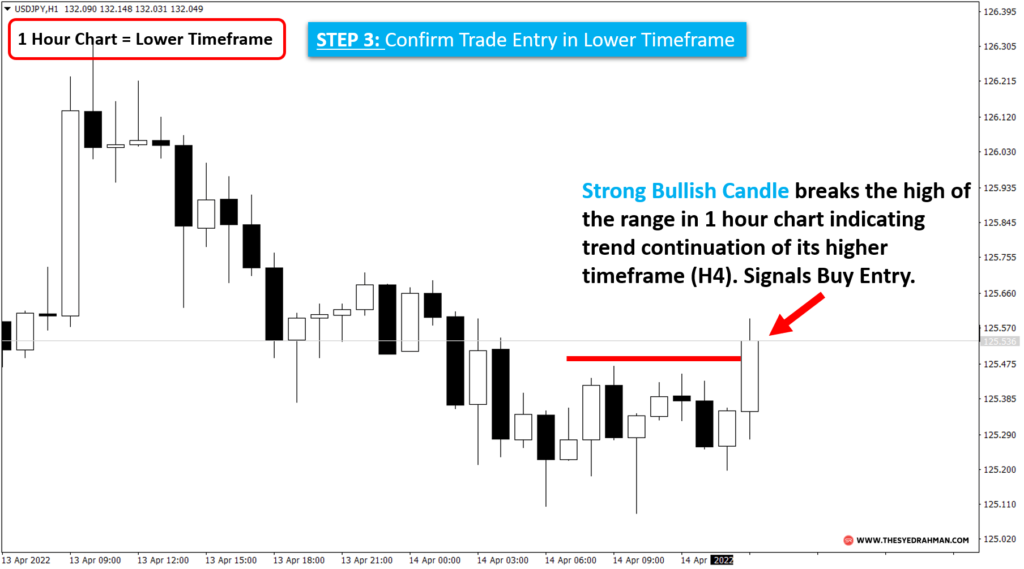
Example: For the trade position in the 4-hour chart, we now will look at the 1-hour chart to make sure we are ready to trigger the order button.
In the 1 hour chart, you can see a strong bullish candle that breaks a ranging pattern at the top (horizontal red line) which indicates increased demand in the market.
Therefore, it is an ideal place to trigger buy orders here for the trade setup we confirmed using the 4-hour and the daily charts.
If you follow this strategy of analyzing several time frames to find, validate and trigger trades, then the chances of winning the trades are almost guaranteed.
So, here is how this trade performed in the 4-hour chart
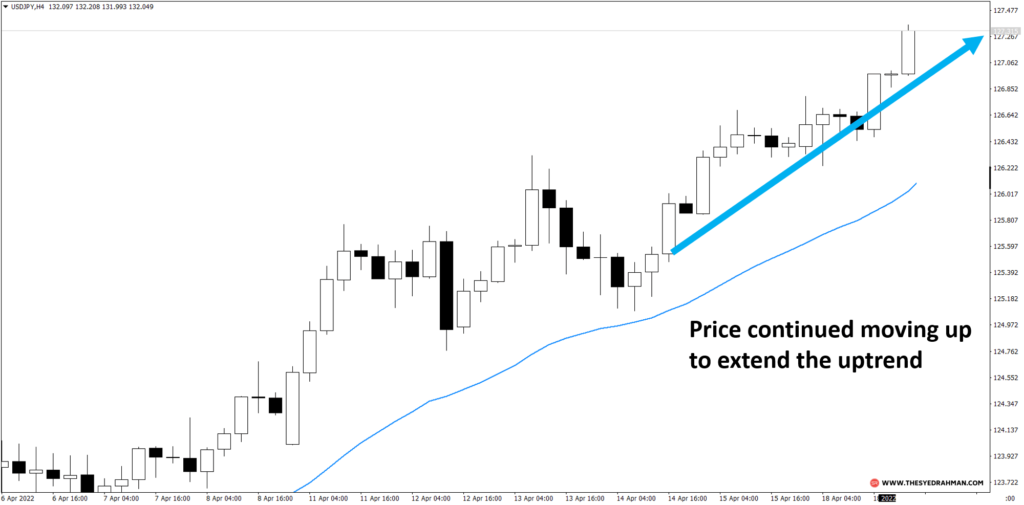
It’s one of the best swing trading strategies using multiple chart analysis.
Practice the strategy and you are more likely to see success in trading the swings.
Multiple Timeframe Analysis Strategy for “Day Trading”
Using multiple timeframes for day trading is very similar to the strategy of swing trading with multiple charts.
The difference is the choice of trading timeframes.
A swing trader mostly uses a medium to higher timeframes to trade and holds the trade position for mostly over a day.
Where day traders hold their trades for a shorter period of time (mostly less than a day).
So, if you are a day trader, and use 1 minute to 1 hour charts to find and execute trades,
Then you can follow the steps I mentioned above for Swing trading, to do multi-timeframe analysis for day trading.
The steps are the same, just make sure you choose your timeframes accordingly to validate the trade position.
So, for example, if you use 30 minute timeframe to trade for a short period of time
-
- Then confirm a strong trade position by whether a strong reversal candlestick pattern or price pattern at a support or resistance level or at any other key market structures in the 30 minute chart
-
- Next, go to the Higher Timeframe which is the 4 hours chart, and look if the overall market direction is similar to the 30-minute time chart, and also make sure both of the charts are indicating bullish or bearish momentum.
-
- And then at the final confirmation stage, wait for a strong candlestick pattern to form in the lower timeframe at the direction of the Trading Timeframe, and buy or sell at the most economical price to aim for maximum profit.
If all these timeframes click and align with each other, then pull the trigger for a potentially winning trade position.
Multi Timeframe strategy for Breakout trading
In this strategy, traders first identify a sideways trading range or any ranging patterns (Ascending triangle, Pennant, etc.) on a higher timeframe chart,
And draw horizontal lines at the top and bottom sides of the range.
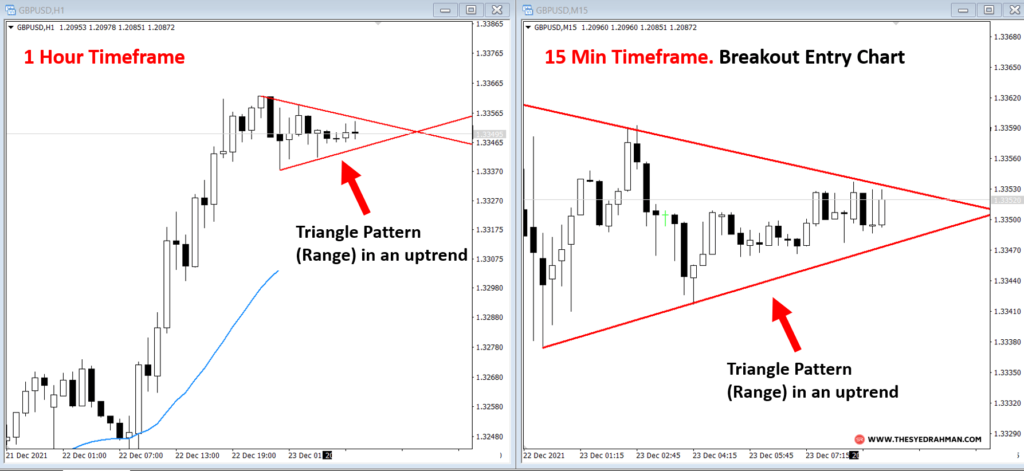
As the price moves on a lower timeframe, traders can then watch for a breakout above or below one of these lines.
When the breakout occurs, it can be a good opportunity to enter a trade on the lower timeframe, since this will allow traders to catch the early stage of the potential move.
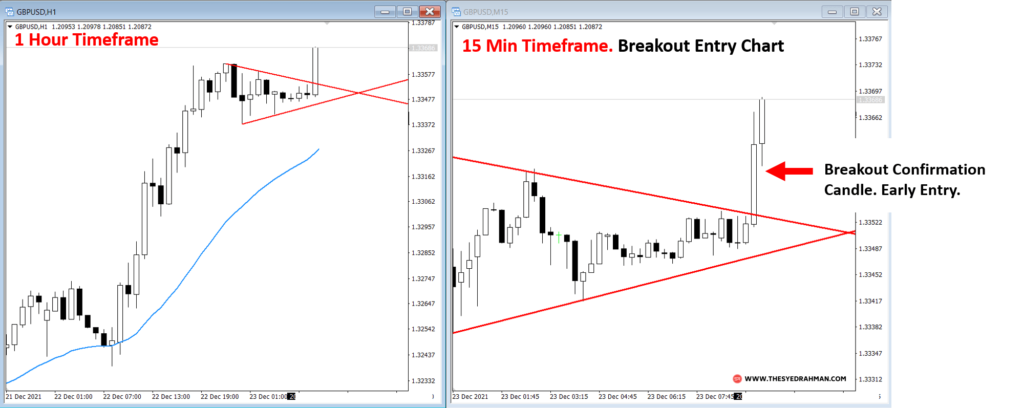
In the example above, by the time the H1 timeframe confirms the breakout at the closing of the H1 candle,
Two candles have formed in the 15 minute chart,
Where the first candle confirms the breakout and early trade entry opportunity to maximize profit.
Note: Try entering in the direction of the trend to save yourself from false breakouts.
Which time frames are the best and most profitable in Multiple Timeframe Analysis?
It is difficult to definitively answer which timeframe is most profitable for multi timeframe chart analysis as it largely depends on the trading strategy and risk tolerance of the individual trader.
Trade any of the chart timeframes you prefer or feel comfortable with.
Just remember the method of combining 3 steps of multi-timeframe analysis to find a trade setup, validate the trade, and then confirm the trade for a better entry price.
Ultimately, you will come to see more winning trades over time if you follow the strategies I have shared in this post.
You can also read the book by Brian Shannon on this topic if you want to enhance your learning on analyzing different charts to make profitable trade entries and exits.
Conclusion
For traders seeking to improve their trading performance, multi timeframe analysis can be a powerful tool to anticipate future market direction.
In addition to technical tools like trendlines and support and resistance levels, traders can also use indicators like moving averages, VWAP, and volume levels to help with their analysis.
So, that is all for today.
Let me know how you like the article, or if you have anything to say or ask.
Join my Download Library for free to download the PDF version of this article and other templates, guides, and reports that will help you get better at trading.
I wish you all the very best
Syed Rahman
NB: Please consider sharing the post if you think other traders will also benefit from this guide.
.


Great job Mr. Syed.
Thank you Mutiu. I hope the contents will help you in your trading.
Thank you.
Outstanding explanation, thanks a lot for your hard work Mr. Syed Rahman
Thank you. Hope this will help in your trading.